Visualize large GeoJSONs in Google Colab
Colab is capable to visualize even 100+ MB GeoJSONs, with the right library. We have a few options:
- Folium and pydeck can directly take a URL as input (except the viewport bounds, see below)
- We can plug in the downloaded JSON content to kepler.gl
- Finally, if you load your file with geopandas (or DuckDB), then lonboard is a great option.
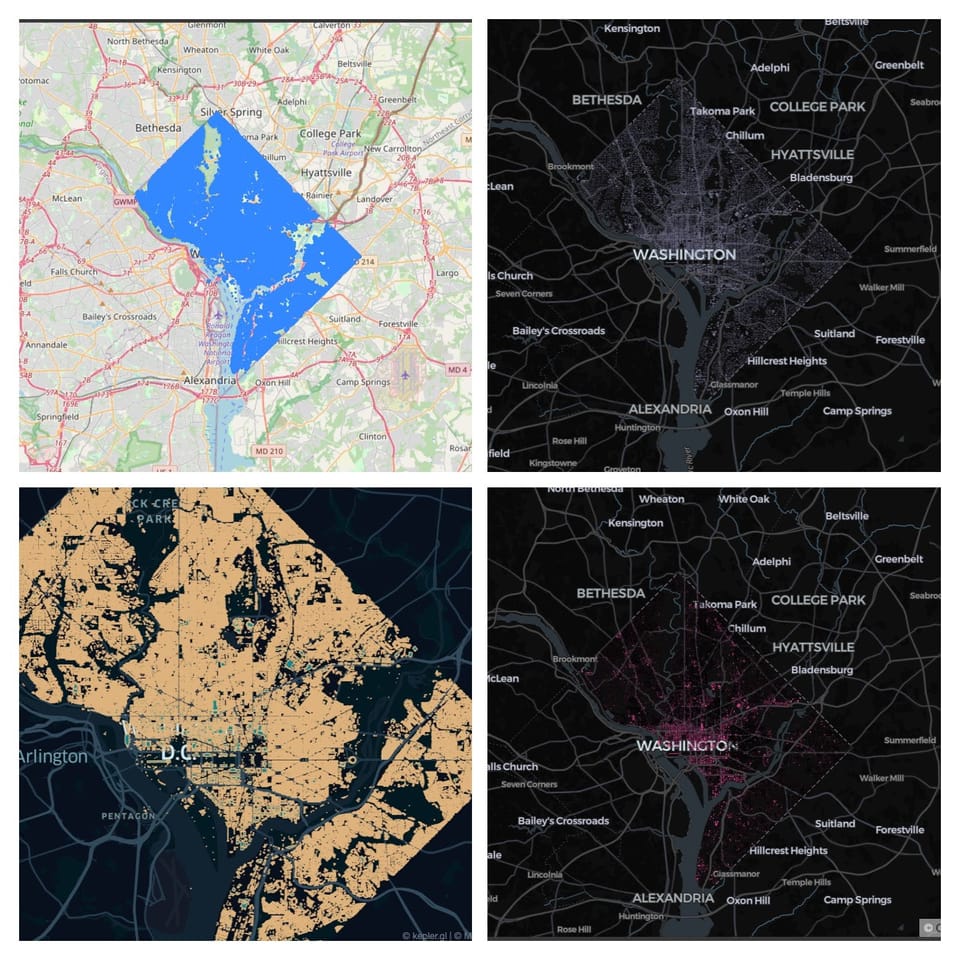
Example dataset
Let's take this dataset of building layouts in DC.
GEOJSON_URL = "https://opendata.dc.gov/api/download/v1/items/a657b34942564aa8b06f293cb0934cbd/geojson?layers=1"A word on the viewport (bounds)
While kepler.gl and lonboard automatically match the viewport to the data, Folium and pydeck don't. So if you want to align the initial viewport to the data, you would still need to load the geojson to geopandas (for example), to fetch the bounds, such as:
import geopandas as gpd

gdf = gpd.read_file(GEOJSON_URL)

bounds = dict(
    zip(
        ["min_lon", "min_lat", "max_lon", "max_lat"],
        gdf.total_bounds,
    )
)

bounds
# Returns:
# {'min_lon': -77.1152269702393,
#  'min_lat': 38.803140886265474,
#  'max_lon': -76.90970681858026,
#  'max_lat': 38.99563017291741}
Folium
!pip install folium --quietimport folium
# Create a map
m = folium.Map()
m.fit_bounds(
[
[bounds["min_lat"], bounds["min_lon"]],
[bounds["max_lat"], bounds["max_lon"]],
]
)
# Add GeoJSON layer
folium.GeoJson(
GEOJSON_URL,
).add_to(m)
m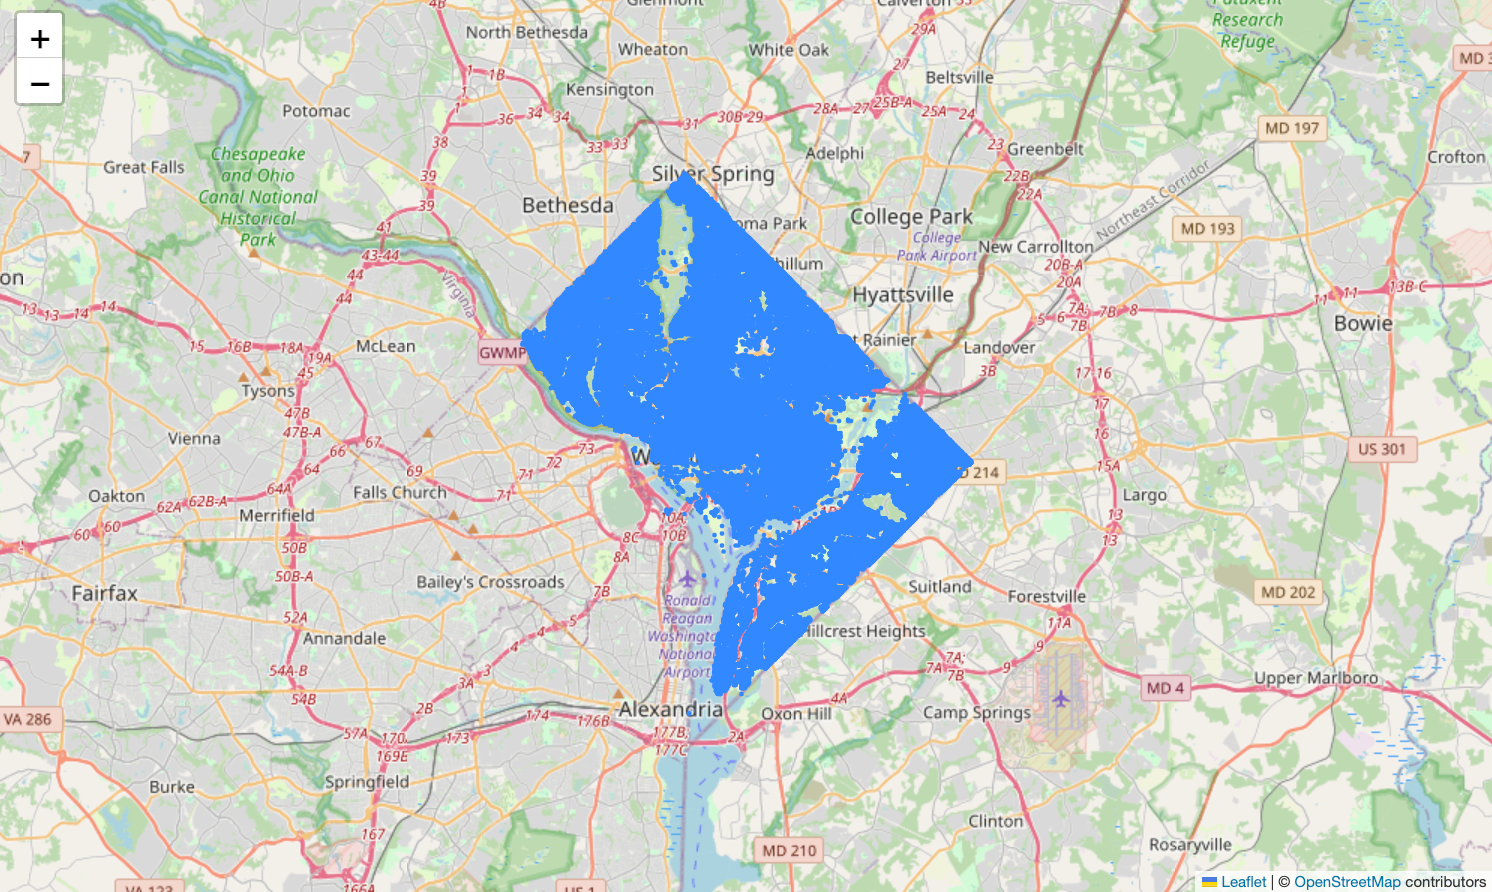
Pydeck
!pip install pydeck --quietimport pydeck as pdk
bbox_corners = [
[bounds["min_lon"], bounds["min_lat"]],
[bounds["max_lon"], bounds["max_lat"]],
]
view_state = pdk.data_utils.compute_view(bbox_corners)
geojson_layer = pdk.Layer(
"GeoJsonLayer",
GEOJSON_URL,
pickable=True,
stroked=True,
autoHighlight=True,
get_fill_color=[200, 200, 255, 200],
extruded=True,
elevation_scale=0.005,
)
pdk.Deck(layers=[geojson_layer], initial_view_state=view_state)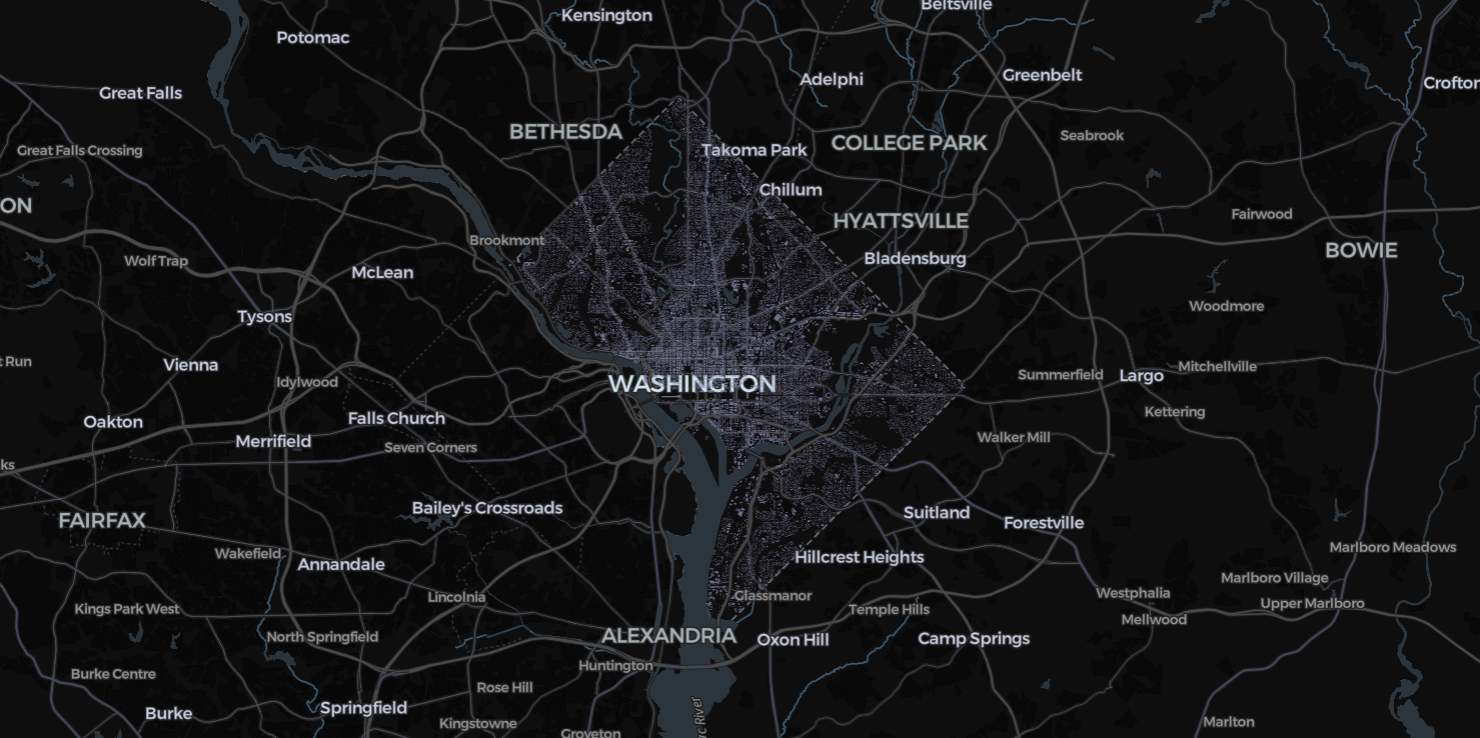
Kepler.gl
There are two details to currently consider when using Kepler.gl in Colab:
- Because of a dependency issue, for now you need to pin to version 0.3.2:
!pip install keplergl==0.3.2 --quiet- And as Colab would warn you if you tried without, you'll need to run:
from google.colab import output

output.enable_custom_widget_manager()
Also, unlike the above libaries, Kepler.gl doesn't take the URL but need to be fed the JSON object:
import requests

response = requests.get(GEOJSON_URL)
geojson_data = response.json()
Now we are ready:
from keplergl import KeplerGl

m = KeplerGl(height=1000)
m.add_data(data=geojson_data, name="feature_collection")
m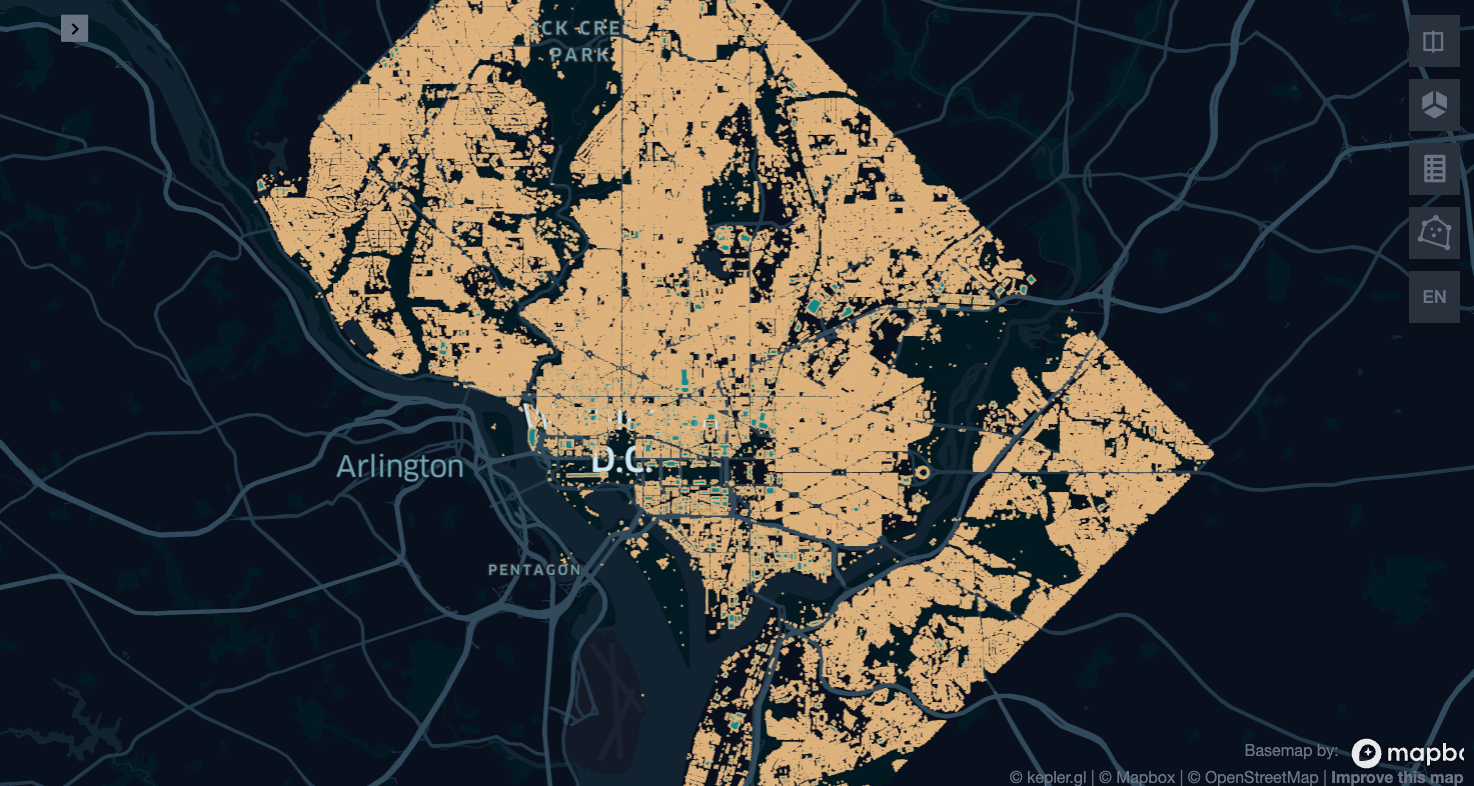
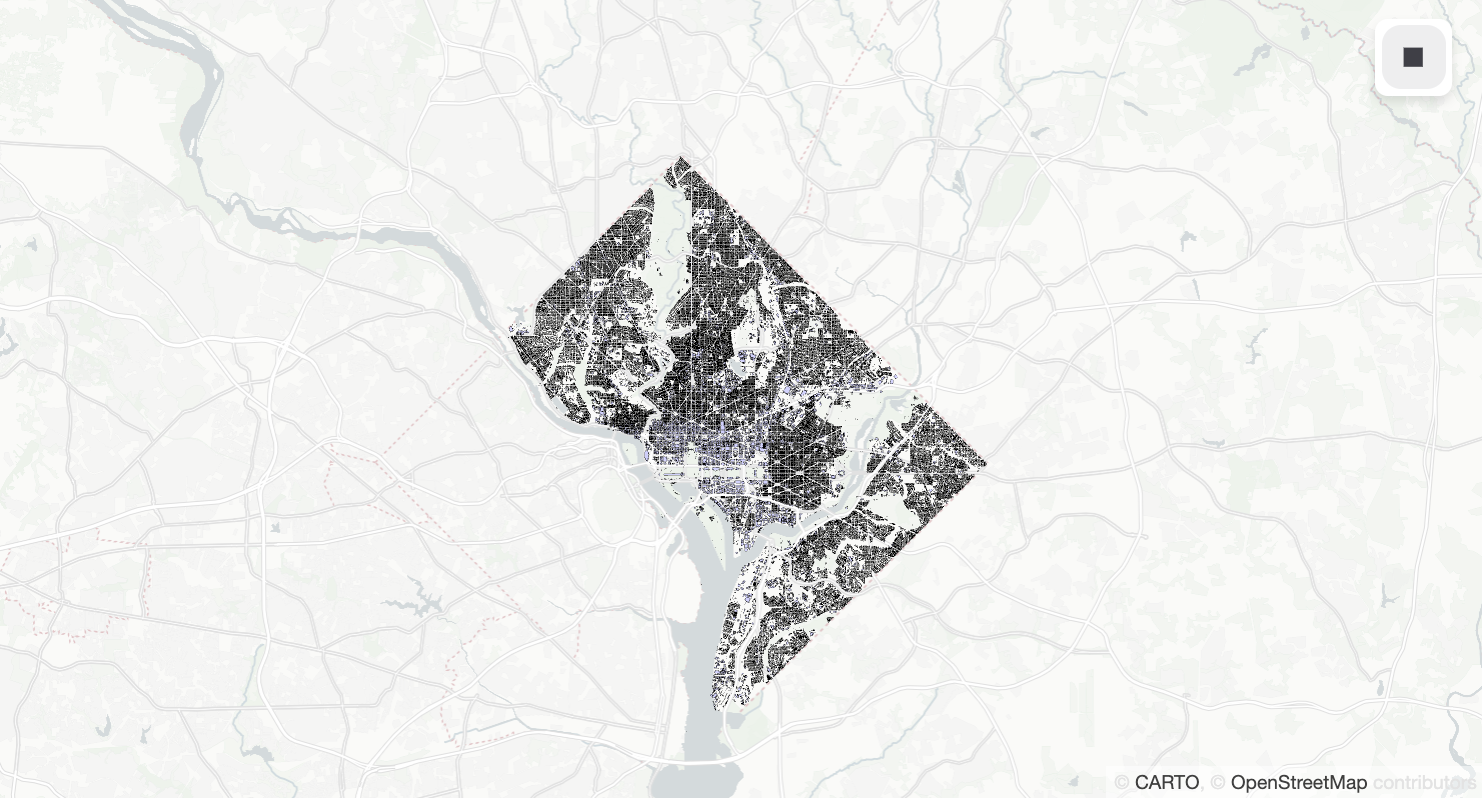
Lonboard
Lonboard really needs a Geopandas object (or a DuckDB connection):
!pip install lonboard --quiet

from lonboard import viz
import geopandas as gpd
gdf = gpd.read_file(GEOJSON_URL)
viz(gdf)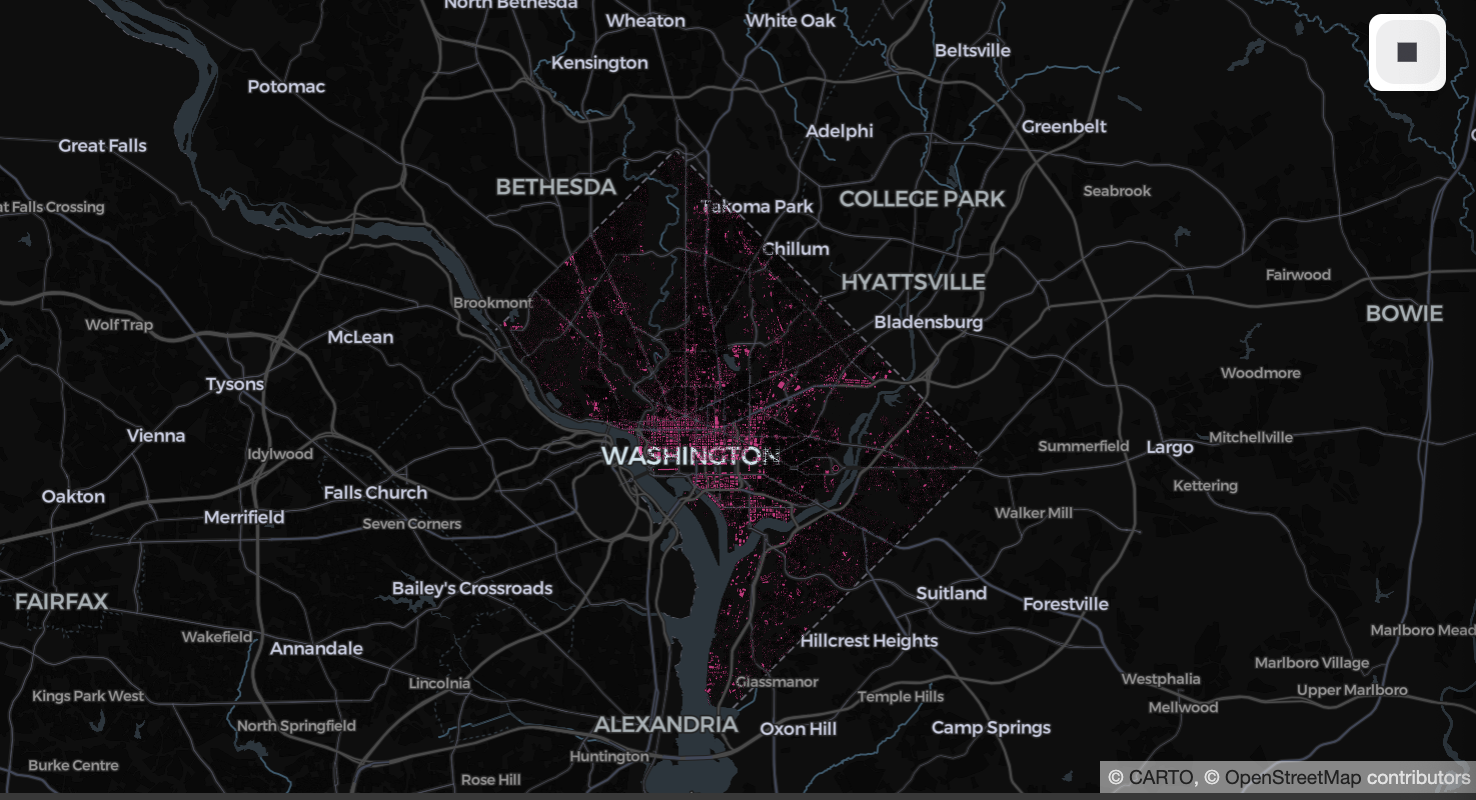
or more customizable:
from lonboard import Map, PolygonLayer

layer = PolygonLayer.from_geopandas(
    gdf,
    get_line_width=1,  # width in default units (meters)
    line_width_min_pixels=0.2,  # minimum width when zoomed out
    get_fill_color=[200, 200, 255, 200],
)

m = Map(layer, _height=1000)
m